Reporting and benchmarking
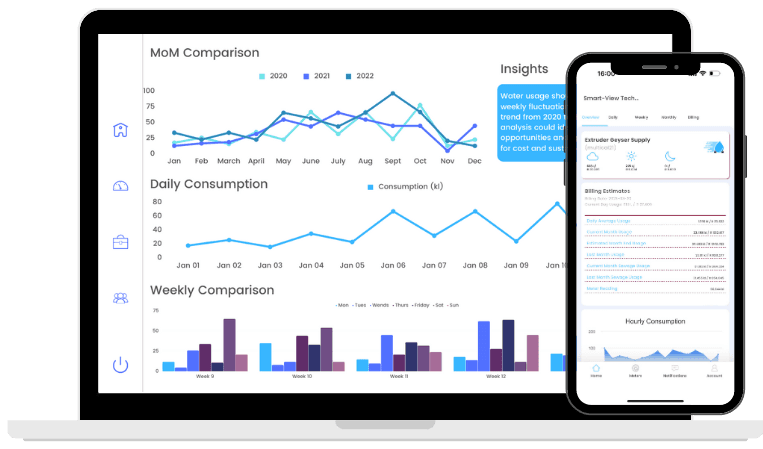
Compare facilities, periods and performance indicators with consistent reporting.
Compare fairly · 01
Compare equivalent operating periods
A larger site or longer shift can use more utilities without being less efficient. Start with a consistent reporting period, then interpret water, energy and gas readings alongside site size, operating hours and activity.
Smart-View supports comparison across facilities so teams can identify patterns that deserve a closer look. Decide which operational context is available before choosing performance indicators.
Compare similar sites or processes.
Record changes in occupancy, shifts or production.
Check gaps and changes in the underlying meter data.
Compare fairly · 02
Use reports to decide what happens next
Choose the decisions the report needs to support: investigating overnight use, reviewing a demand peak or checking whether a repair changed consumption. Agree the audience and review frequency during setup.
Keep the source period and assumptions with any result. A reduction should be compared with a relevant baseline, not an unusually busy or quiet day.
See Smart-View Technology in action
Share your utility-management priorities. We’ll use the conversation to understand your sites, data sources and practical next steps.