Additional Data
Time needed: 1 minute
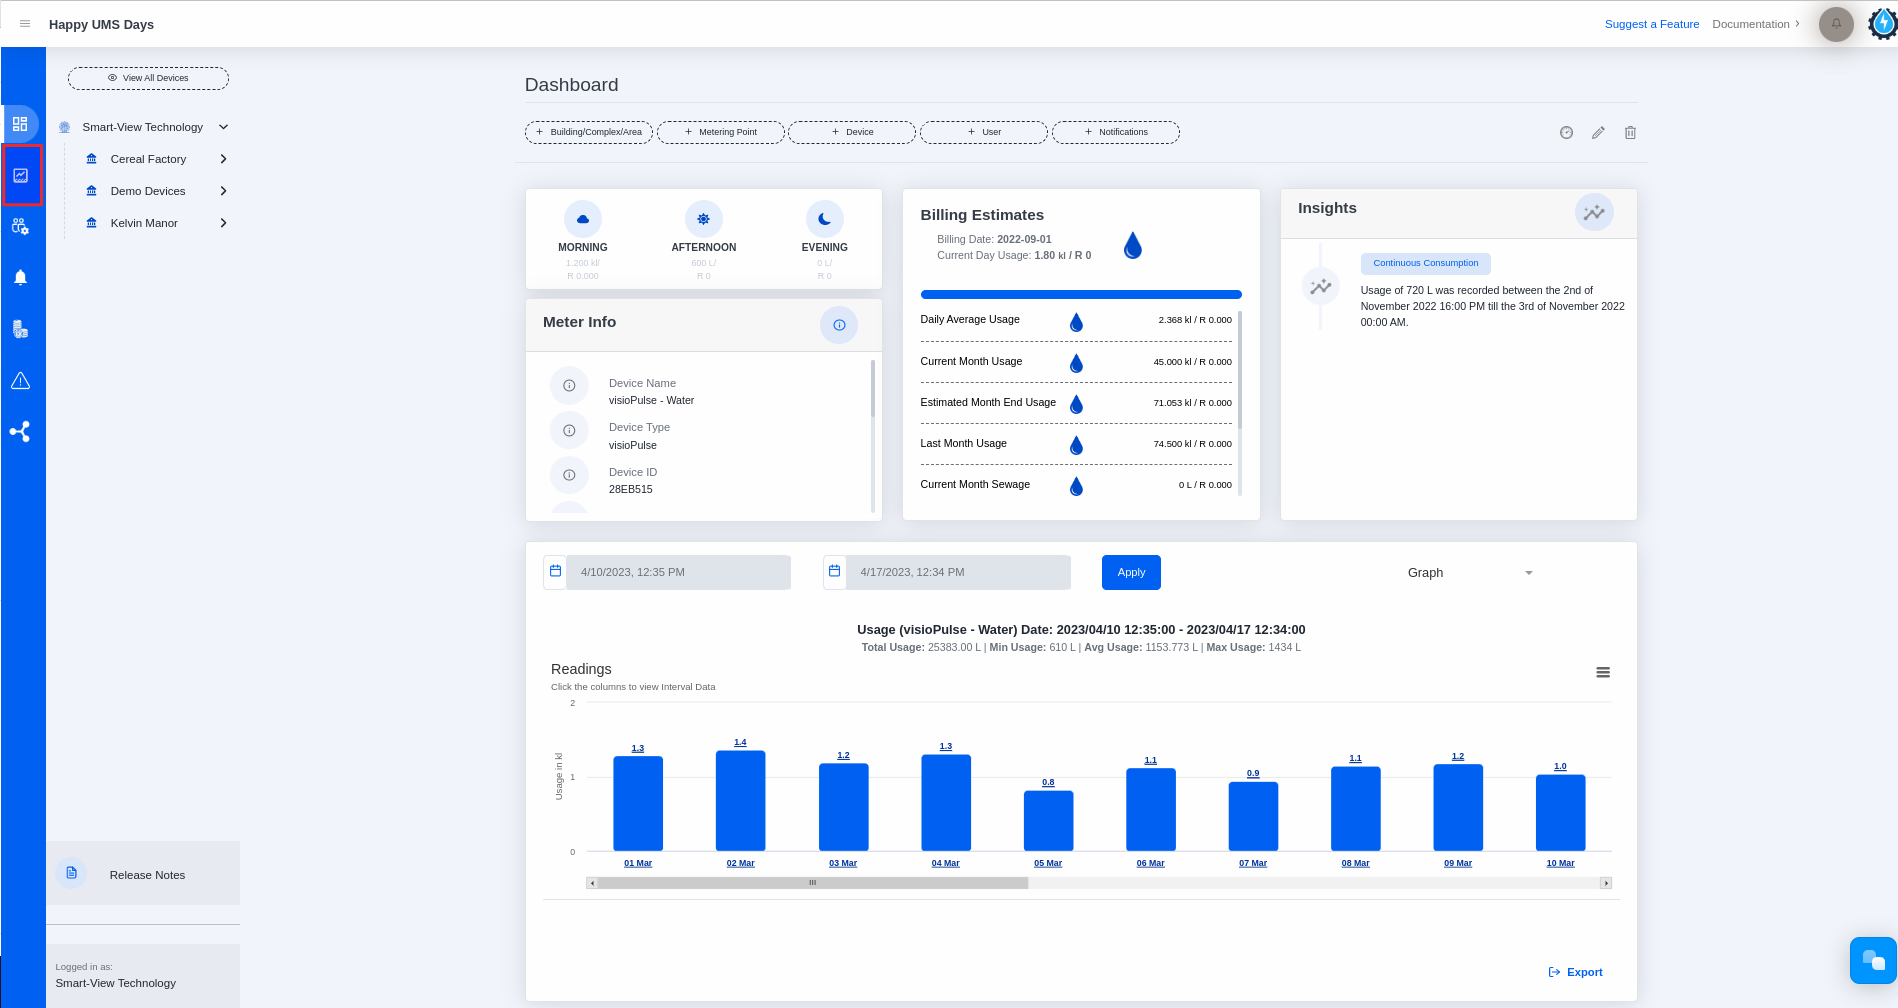
- Select the Reporting icon from the left side navigation bar

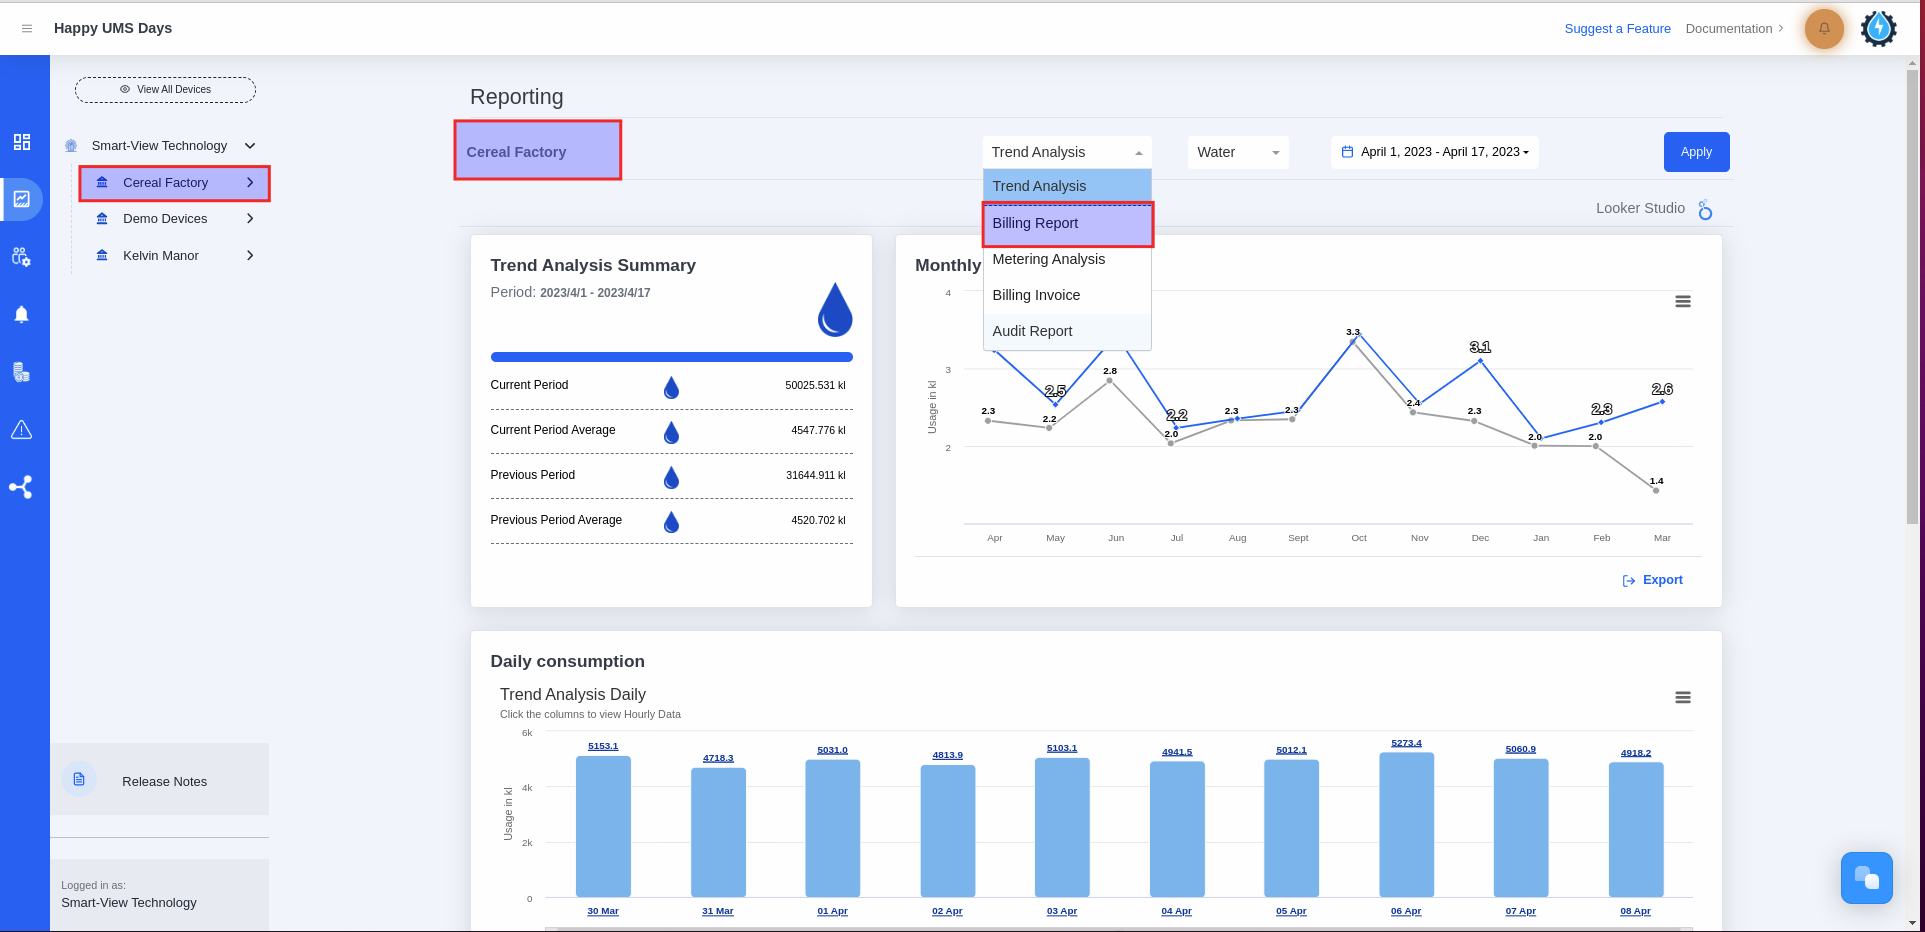
- Select the Billing Report from the Report Type list
– Please select the building or complex.
– Click on the Report Type dropdown list.
– Please select the billing report from the dropdown list.

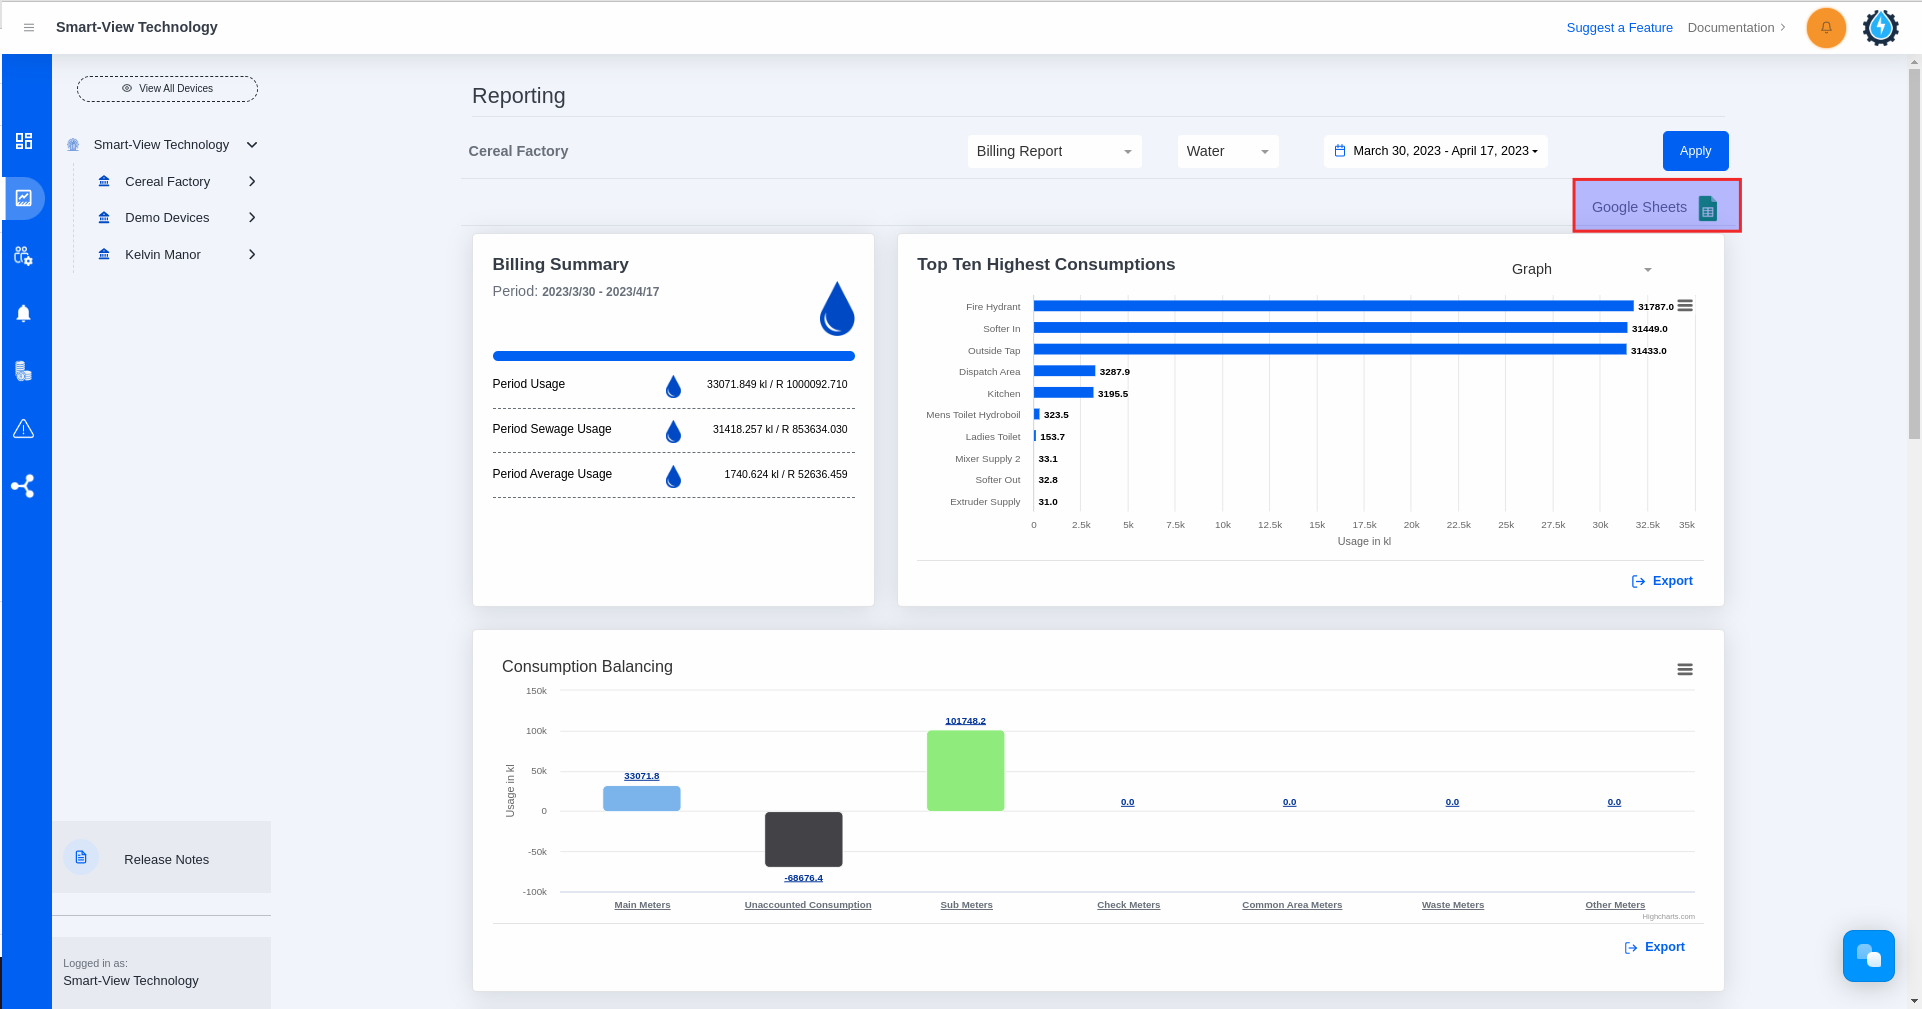
- Please click on the Google Sheets icon.
– You will land on the Billing Report Page, which consists of the following:
1. Billing Summary Card
2. Top Ten Highest Consumptions graph
3. Consumption Balancing graph
4. Continuous Consumption graph
5. Zero Consumption table
6. Meter Readings table
Please note the following:
– Please make sure that you sync the Billing Report and click the ‘Apply’ button.
– The Google Spreadsheet will open up in a new tab.

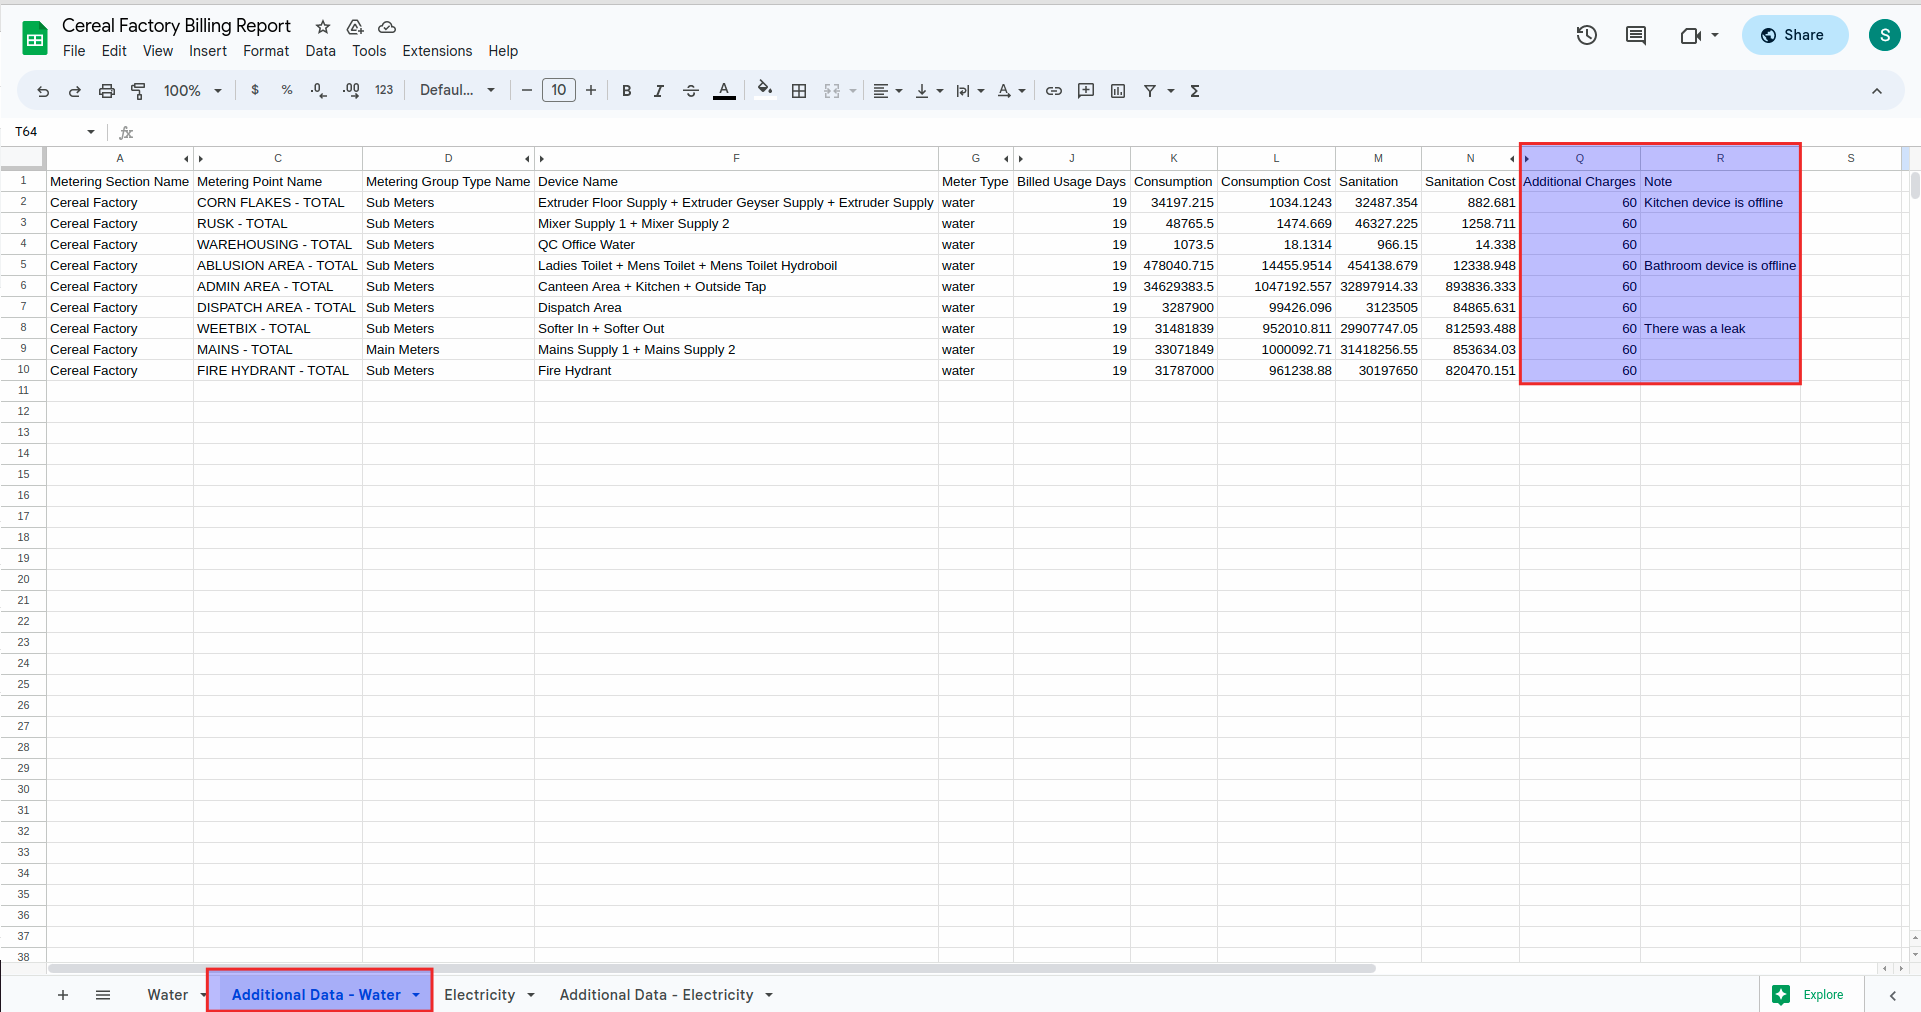
- Please click on the ‘Additional Data’ tab.
Please note the following:
– You can add any additional charges to the spreadsheet by creating a new column and entering the charge for each unit at the end.
— For example, the Additional Charges and Note columns, which are marked with a red square, are newly added columns.
– When you add additional charges, they will appear on the unit’s metering point statement, and the tenant will be able to see the additional charges on the statement.
– Once you close the billing period cycle, you will not be able to edit the spreadsheet.


